Showing posts with label global warming. Show all posts

Sunday, August 8, 2010

Russia's Portentous Summer

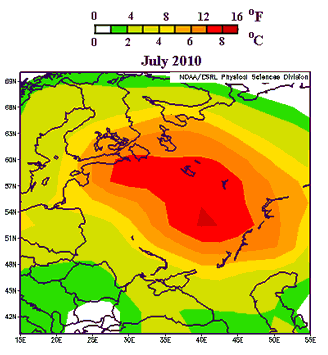
Jeff Masters says, "one of the most remarkable weather events of my lifetime is unfolding this summer in Russia" where the current heat wave is pretty much entirely off the historical charts. For comparison, the 2003 heat wave across Western Europe killed more than 40,000 people - and the present heat wave in Russia is far more extreme than that:


Says Masters:
The past 25 days in a row have exceeded 30°C (86°F) in Moscow, and there is no relief in sight--the latest forecast for Moscow calls for high temperatures near 100°F (37.8°C) for the majority of the coming week. As I reported in yesterday's post, the number of deaths in Moscow in July 2010 was about 5,000 more than in July 2009, suggesting that the heat wave has been responsible for thousands of deaths in Moscow alone. I would expect that by the time the Great Russian Heat Wave of 2010 is over, the number of premature deaths caused by the heat wave will approach or exceed the 40,000 who died in the 2003 European Heat Wave. As seen in Figure 2, the Russian heat wave of this year is more intense and affects a wider region than the great 2003 heat wave, though the population affected by the two heat waves is probably similar.
Another commentator writes:
To put this in rough perspective -- and note this is not absolutely precise, it's purely ballpark to give you some feel for what the Russian people are enduring -- if this heat wave was hitting North America, it would be near 100°F in Fairbanks, Alaska. Most of Canada would be baking at 100° or higher, the northeast, from Maine to the Great Lakes region would be hitting upwards of 105° everyday, even the nightly low in the massive urban heat islands of New York and Chicago would be over 90°! The midwest grain belt and parts of the Pacific Northwest would not see a drop of rain for two months and pushing as high as 110° in places. The desert southwest, even some of the higher elevations of Nevada, Arizona, New Mexico, and West Texas, would be as uninhabitable as Death Valley or the Sahara.

It would mean nation-wide massive power brownouts, unprecedented crop failures, water rationing like you have never seen, record wildfires raging in dozens of states, thousands of deaths [Correction: Dr. Jeff Masters at WeatherUnderground informs me it would probably more like tens of thousands of deaths] and life threatening heat related illness, roads and highways clogged with broken-down, over-heated cars, and emergency services stretched beyond the breaking point across the US and Canada. The conditions could be so severe in places, especially if the wave persisted for a couple of years, that it could produce mass migration, i.e., refugees, the likes of which haven't been seen since the Great Depression.
Tens of thousands of deaths from the sort of weather event that will become more common as global warming continues apace. The usual caveat applies about the fallacy of attributing individual weather events to long-term climate trends, but needless to say, a warming planet will experience more severe heat waves. As Masters notes:
Looking back at the past decade, which was the hottest decade in the historical record, Seventy-five countries set extreme hottest temperature records (33% of all countries.) For comparison, fifteen countries set extreme coldest temperature records over the past ten years (6% of all countries).
Weather events like these heat waves have proven their capacity to have death tolls in the five figures. But perhaps the most ominous portent of the Russian heat wave has been the government's move to ban grain exports - a response to the decimation of wheat crops due to the wildfires and drought that have attended the heat wave. Natural calamity leading to resource nationalism, causing food prices to spike across the globe: this story will be written again in the decades to come.

Thursday, July 15, 2010

First Half of 2010 is the Warmest on Record

June 2010 was the hottest June on record, 1.22°F above average. So was the period of April-June, 1.26°F above average. And January through June - the entire first half of 2010 - were also the hottest on record, 1.22°F above average. A trifecta!

jan-june 2010 world temperature map

Pop quiz: what do these facts, and the giant oil spill and ecosystem carnage in the Gulf of Mexico, and the environmental damage and civil unrest in the Niger Delta, among many other sordid, disturbing facts about life on Earth in the early 21st Century, have in common?

George Will, among others, would say: nothing. Nothing at all. Because he does not believe that the world is warming due to our burning of fossil fuels; indeed, he does not believe we are in a period of global warming at all, as he argued in an editorial last year. He stated there that
according to the U.N. World Meteorological Organization, there has been no recorded global warming for more than a decade, or one-third of the span since the global cooling scare.
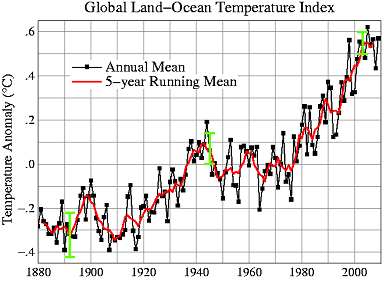
This assertions was factually incorrect - the WMO said no such thing - as were pretty much all of Will's assertions in the editorial. But what would make Will not only believe this assertion, but decide to broadcast it to the world from his extremely authoritative position as an editorialist for the Washington Post? Perhaps it was his interpretation of the fact that the ten warmest years on record, according to NOAA, have been, in order, 2005, 1998, 2003, 2002, 2006, 2009, 2007, 2004, 2001, and 2008. Or perhaps it's just his reading of this chart:


These data points pretty strongly suggest that the world is in a period of warming, and the record for 2010 is clearly continuing the trend. But to correctly understand the data that are being represented here, you have to meet at least two sriteria: 1) Have the statistical acumen and general intelligence of at least a second-grader; and 2) Not be a disingenuous toady for the fossil fuel industry. On at least one of these points, Will has obviously failed.

Monday, July 12, 2010

The Coming Heat Wave Wave

The weather where I live - a large East Coast metropolis somewhere between Bridgeport, CT and Trenton, NJ - was notably warm last week, as it was for much of the East Coast. At Dot Earth, Andrew Revkin links to a study that predicts many more such heat waves in the future.

hot seasons us global warming map

On the study:
"Using a large suite of climate model experiments, we see a clear emergence of much more intense, hot conditions in the U.S. within the next three decades," said Noah Diffenbaugh, an assistant professor of environmental Earth system science at Stanford and the lead author of the study.

Writing in the journal Geophysical Research Letters (GRL), Diffenbaugh concluded that hot temperature extremes could become frequent events in the U.S. by 2039, posing serious risks to agriculture and human health.

"In the next 30 years, we could see an increase in heat waves like the one now occurring in the eastern United States or the kind that swept across Europe in 2003 that caused tens of thousands of fatalities," said Diffenbaugh, a center fellow at Stanford's Woods Institute for the Environment. "Those kinds of severe heat events also put enormous stress on major crops like corn, soybean, cotton and wine grapes, causing a significant reduction in yields"...

In the study, Diffenbaugh and Ashfaq used two dozen climate models to project what could happen in the U.S. if increased carbon dioxide emissions raised the Earth's temperature by 1.8 degrees Fahrenheit (1 degree Celsius) between 2010 and 2039 – a likely scenario, according to the International Panel on Climate Change.

In that scenario, the mean global temperature in 30 years would be about 3.6 degrees F (2 degrees C) hotter than in the preindustrial era of the 1850s. Many climate scientists and policymakers have targeted a 2-degree C temperature increase as the maximum threshold beyond which the planet is likely to experience serious environmental damage. For example, in the 2009 Copenhagen Climate Accord, the United States and more than 100 other countries agreed to consider action to reduce greenhouse gas emissions "so as to hold the increase in global temperature below 2 degrees Celsius."

But that target may be too high to avoid dangerous climate change, Diffenbaugh said, noting that millions of Americans could see a sharp rise in the number of extreme temperature events before 2039, when the 2-degree threshold is expected to be reached.

"Our results suggest that limiting global warming to 2 degrees Celsius above preindustrial conditions may not be sufficient to avoid serious increases in severely hot conditions," Diffenbaugh said.
The study predicts that "an intense heat wave – equal to the longest on record from 1951 to 1999 – is likely to occur as many as five times between 2020 and 2029 over areas of the western and central United States." In other words, imagine you are 60 years old or so, and think of the absolute most extreme heat wave you've experienced in your entire life.

Twenty years from now, such heat waves will be occurring once every year or two.

And needless to say, there is zero evidence that we are prepared to seriously address the problem of global warming sufficiently enough to actually achieve the 2-degree goal. This is because we are a short-sighted, greedy, and not-quite-intelligent-enough species, and the world we bequeath to future generations will be severely damaged as a result. Very likely we will go down in history as a generation of obnoxious assholes who were too enthralled with our SUVs and plastic tchotchkes to make even the most minimally adequate moral calculations about our actions.

And if you think things might change once the effects of global warming actually start showing up in earnest... well, I have my doubts. Here is Revkin quoting social scientist Robert Brulle:
I’m up in New Hampshire, and the signs of climate change are everywhere, should you choose to see them. The strawberry season has already passed (it usually comes in late July), and you can now get fresh blueberries (3 weeks ahead of normal). The lake I am staying at has lost a lot of water clarity due to an excessive amount of tannic acid. The lake had its earliest ice out this year in memory, and so the leaves had had a longer time to decompose, thus releasing more tannic acid to the water. The water looks more like what you see in the Pine Barrens than in New Hampshire. These changes are all just taken in stride. Climate change remains something abstract and far away, both in time and space. In short, these changes are being normalized.
Cloudier lakes in New Hampshire today, an inundated Bangladesh tomorrow, and everything changing at the rate of one very slowly boiling frog. This is just a very difficult sort of calamity for our species to respond to.

Saturday, February 13, 2010

Russians Call it 'Sneg'

I know what you're thinking. You're thinking: how much of the Northern Hemisphere is currently covered in snow, and can this information be represented in mustard yellow? Well, aren't you in luck:


That's from the Rutgers University Global Snow Lab. By way of commentary, Jeff Masters says:
We live in the United States of Snow. A rare Deep South heavy snowstorm whipped across the southern tier of states yesterday, dumping six-plus inches of snow over portions of Louisiana, Mississippi, Alabama, Georgia, South Carolina, and North Carolina. Even Florida got into the act, with up to two inches recorded in the extreme northwestern Panhandle. The snowstorm left 49 of the 50 states with snow cover, according to an article by Associated Press. Hawaii was the lone hold-out. David Robinson, head of the Rutgers Global Snow Lab, said that 67.1% of the U.S. had snow cover on Friday morning, with the average depth a respectable 8 inches. Normally, the U.S. has about 40 - 50% snow coverage during the 2nd week of February. January had the 6th greatest snow cover in the 44-year record over the contiguous U.S., and December 2009 had the most snow cover of any December on record. The current pattern of record heavy snows over the the Eastern U.S. is primarily due to a natural oscillation in the Earth's climate system called the North Atlantic Oscillation (NAO).
If one single person comments that this proves global warming does not exist, as God is my witness I will reach through the Internet and pop you right in the nose. I will then proceed to make a substantive argument as to why all this snow is actually just what you'd expect (in the short term) in a warming world, but I'd really prefer to not have to do that.

Tuesday, December 15, 2009

Yet More on the Fate of the Planet

Via The Map Room and mapperz, here's another nice visualization of the calamity coming down the pike.


The image on the left anticipates increasing greenhouse gas emissions over the course of the century, which leads to a rise of just over 4C; the one on the right shows what'll happen if emissions gradually decrease - a rise of only 2C.

But obviously the warming, in either scenario, won't be uniform. The images really show how much more dramatic warming is forecast to be over land than over the ocean. Bear that in mind when you hear forecasts of like 4C warming by the end of this century: that's a global average, but it'll be considerably higher over land, which of course is where humans and cute baby elephants and things tend to live.

Meanwhile, talks in Copenhagen are hitting various sorts of predictable roadblocks:
China and the United States were at an impasse on Monday at the United Nations climate change conference here over how compliance with any treaty could be monitored and verified.

China, which last month for the first time publicly announced a target for reducing the rate of growth of its greenhouse gas emissions, is refusing to accept any kind of international monitoring of its emissions levels, according to negotiators and observers here. The United States is insisting that without stringent verification of China’s actions, it cannot support any deal.
If there's reason for optimism about the world's ability to do anything useful to slow our eminently foreseeable slide into global environmental devastation, it is this: if the US and China can just work out a framework for tackling the problem in a meaningful way, then Europe and Japan would surely follow; and just like that the countries producing a substantial majority of emissions will be on board. The rest of the world would not stand in the way (though OPEC would surely throw a fit).

If there's reason to be pessimistic about same, however, it's that the US and China would both have to agree to do something to meaningfully thwart global warming. For China, that would mean altering the model of industrialization that has brought them unprecedented and almost miraculous wealth in the last couple of decades, not to mention a growing role as a global power. For the US, it would mean overcoming the ossification of decline, including the extensive corruption of the political process and Versaillization of the political media, that appears to have compromised our ability to achieve any significant reforms on any front. In other words...

Sigh.

UPDATE: But here is some good news:
Negotiators have all but completed a sweeping deal that would compensate countries for preserving forests and in some cases other natural landscapes like peat soils, swamps and fields that play a crucial role in curbing climate change.

Environmental groups have long advocated such a compensation program because forests are efficient absorbers of carbon dioxide, the primary heat-trapping gas linked to global warming. Rain forest destruction, which releases the carbon dioxide stored in trees, is estimated to account for 20 percent of greenhouse gas emissions globally.

The agreement for the program, once signed, may turn out to be the most significant achievement to come out of the Copenhagen climate talks, providing a system through which countries can be paid for conserving disappearing natural assets based on their contribution to reducing emissions.
So it's good to hear some concrete good will come out of this meeting. And of course preserving ecosystems carries all sorts of environmental benefits along with it, beyond the increased absorption of greenhouse gases. But on the other hand:
A final agreement on the program may not be announced until the end of the week, when President Obama and other world leaders arrive — in part because there has been so little progress on other issues at the climate summit, sponsored by the United Nations.
Baby steps... Who knows. we may yet manage to cobble together a decent approach to global warming by the end of the century or so.

Tuesday, December 8, 2009

Global Warming is Gonna Be Bad for the Midwest

While bureaucrats from around the world are in Copenhagen haggling over an arcane agreement that may have profound effects on the state of the entire planet a century from now, you can enjoy this interactive map, which projects temperature rise across the the lower 48 states by the 2080s:

21st century global warming map of the us

It's based on a "medium" projection of greenhouse gas emissions. It shows at least a 4F temperature rise relative to a 1961-1990 baseline pretty much everywhere and 6-8F in much of the Interior West and Midwest (a.k.a. where our food comes from). In fact the seven states that are expected to heat up the most are all in the Midwest or thereabouts: Nebraska and Iowa (9.4F according to the moderate scenario), South Dakota (9.3), Missouri (9.2), Illinois (9.1), Kansas (9.1), and North Dakota (9.0).

The maps are based on a report (pdf) from The Nature Conservancy:
To help average Americans, policy makers and other local stakeholders better understand how climate change will directly impact their states, The Nature Conservancy has analyzed the latest and most comprehensive scientific data available to calculate specific temperature projections for each of the 50 US states over the next 100 years.

The Nature Conservancy also worked with the University of Washington and the University of Southern Mississippi to develop a new on-line tool that combines the latest scientific data and climate models with geographic information systems (GIS), statistical analysis and web-based mapping services. This tool, Climate Wizard (www.climatewizard.org), represents the first time ever that the full range of climate history and future projections for specific landscapes and time frames have been brought together in a user-friendly format that is available to a mass audience.
It also predicts rainfall:

us global warming precipitation prediction map

Bad news for California and Texas. Oh well, at least they're not the two most populous states in the country or anything.

Via Huffington Post.

Monday, November 9, 2009

Because I Haven't Gotten Extremely Depressed About Global Warming in the Last Couple of Weeks...

The British government recently came out with a new interactive map, posted by The Guardian here, that shows the likely impacts of global warming, assuming our species continues our sit-on-our-asses-till-we're-all-fried approach to this looming catastrophe:

uk met global warming map

Says The Guardian:
The map was launched to coincide with the London Science Museum's new Prove it climate change exhibition by David Miliband, foreign secretary and his brother Ed Miliband, energy and climate change secretary. It comes in advance of key political talks on climate change in December in Copenhagen, where British officials will push for a new global deal to curb emissions.

The Miliband brothers said a new deal needed to be strong enough to limit global temperature rise to 2C, although many involved in the negotiations privately believe this to be impossible. A joint press release from the government and the Met Office released to promote the map says the government is aiming for an agreement that limits climate change "as far as possible to 2C".
The map presumes a global average rise of 4 degrees Celsius, a disastrous scenario which is nonetheless where we are very probably headed (as the UK Met Office says itself). That is, again, assuming that we don't take significant action to thwart such a catastrophe.

I personally consider such action highly unlikely for a number of reasons, which is really too bad, because this forecast is a terrible one. It calls for temperatures to be 6-7C warmer across most of the continental US, for instance. That's about 10-13 degrees Fahrenheit; that's like the difference between spring and summer. The "hottest days of the year could become as much as 10-12C (18-22F) warmer [!] over eastern North America," says the map; it's even worse for the Arctic, where a rise of 15C is so off-the-charts huge that's it's just impossible to predict what sort of effects it will have; beyond the prospect of a positive feedback from Arctic methane release, it's really not much fun to think about it anymore.

I will just stand up on my little digital soapbox here and make the point, not for the first time, that this dystopic future is the price we're paying for our cheeseburgers and our SUVs. It is really a profoundly, spectacularly, stupidly high price to pay for a lifestyle that, frankly, is not all that great to begin with. But no doubt this lesson will sink in... oh, right about the time that Bangladesh does.

Via The Map Room.

Sunday, July 19, 2009

Hot Hot Heat

Another map from that Jeff Masters post confirms something I had strongly suspected: Texas was hot in June!

june 2009 temperature anomalies

But then, so was the Southeast, the Maritime Provinces, the North Pacific, the East Pacific, Western Europe, Eastern Europe, Siberia, China, India, the Middle East, just about all of Africa... in fact, Masters says, it was the second-warmest June in history, just a hair shy of 2005's blistering record. Says Masters:
The period January - June was the fifth warmest such period on record. Global temperature records go back to 1880. The most notable warmer-than-average temperatures were recorded across parts of Africa and most of Eurasia, where temperatures were 3°C (5°F) or more above average. The global ocean Sea Surface Temperature (SST) for June 2009 was the warmest on record, 0.59°C (1.06°F) above the 20th century average. This broke the previous June record set in 2005. The record June SSTs were due in part to the development of El Niño conditions in the Eastern Pacific. If El Niño conditions continue to strengthen during the coming months, we will probably set one or more global warmest-month-on-record marks later this year. The last time Earth experienced a second warmest month on record was in October 2008.
Of course, if you are Rep. Blaine Luetkemeyer (R-MO), you may see this as evidence that we are in a period of global cooling. But also you would be an idiot.

Northwest Passage Becoming Alarmingly Passable

Jeff Masters says: "The fabled Northwest Passage is more than half clear now, and has a good chance of melting free for the third consecutive year--and third time in recorded history." This map shows "ice extent as measured by an AMSR-E microwave satellite sensor on July 15, 2009."

ice-free northwest passage map

The sea ice extent in the Arctic in June was the 4th-lowest ever recorded. (Records only go back to 1979, but it's unlikely any year before that would have challenged the recent records since at least the Medieval Warm Period.) And, Masters notes, "The ice-free seas that nearly surround Greenland now have contributed to temperatures of 2 - 3°C above average over the island over the past ten days. With clear skies and above-average temperatures likely over most of the island for at least the next week, we can expect near-record July melting over portions of the Greenland Ice Sheet this month." Nothing ominous about that!

Thursday, July 2, 2009

The Changing Hardiness Zones of the US

From the Baltimore Sun's B'More Green blog comes news (via the Sun's Garden Variety blog) that the US Department of Agriculture is planning to revise its map of plant hardiness zones across the country by this fall. But the Arbor Day Foundation has already updated changes in hardiness zones from 1990 to 2006, which they show in their interactive map:

us hardiness zones

This shows the changes in zone classification over that time period:


Some isolated areas of the interior West and Midwest have actually warmed enough to move up two zones, while a few areas in the Southwest have actually gone down a zone. But you can infer from the streaked pattern that most areas, especially in the eastern two-thirds of the country, have warmed by the equivalent of about half a zone. That actually strikes me as a bit extreme; zones are classified by average annual low temperature, as per the scale on the left; so if I'm reading it right, a half-zone change would correspond to the average annual low being about 5 degrees F warmer in 2006 than it was in 1990. Is that really plausible? Average temperatures certainly haven't warmed by that much; but maybe the climate has changed in such a way that especially cold snaps are less common at the height of winter. I don't know.

Tuesday, June 30, 2009

Agricultural Production in a Warming World

More on global warming, this time from Conor Clarke, who links to William Cline's study Global Warming and Agriculture: Impact Estimates by Country. Clarke reproduces two maps from that study; this one shows "the change in agricultural productivity (by 2080) taking into account the potential benefits of 'carbon fertilization' (the increase in yield that occurs in a carbon rich environment"):

gw ag prod proj map

And this one shows the same without projecting carbon fertilization benefits:

gwappm2

Says Clarke:
The basic points of Cline's book are that, by the end of the 21st century, (1) climate change will lead to a slight decline in global agricultural productivity; and (2) climate change will lead to a giant decline in agricultural productivity in Africa, South America and India...

As a sidenote, I think it's important to recognize that deep brick color falling over most of Africa, South Asia and Latin America -- all places where agricultural productivity will fall by more than 25% -- actually hides big differences. For example, Cline reports that the southern regions of India would experience potential output declines of 30-35%, while northern regions would experience declines of 60%.
These maps, besides being delightfully Mondrianesque, illustrate beautifully (if that's the right word) the extent to which the business end of the global warming Howitzer is aimed squarely at the developing world (though the souther half of the UScould have some tough times ahead as well. The forecast for South Asia, which has enormous populations and is not that far removed from historically experiencing famine, and which could be among the most catastrophically inundated by rising seas starting near the end of the century, is especially distressing.

By contrast, under a favorable 'carbon fertilization' scenario much of the developed world actually comes out ahead (again, with the exception of the southern US, as well as much of Australia). China - around which the future track of global warming increasing hinges - also does rather well in the favorable scenario, and only somewhat poorly in the non-fertilization scenario. (By the way, as Clarke notes, "The effects of carbon fertilization are very uncertain, and depend crucially on the availability of other resources -- water for irrigation, say -- that will also be affected by global warming... [But] even if carbon fertilization yields large benefits, Cline estimates a decline in global agricultural productivity.)

As always with climate projections, there is a lot of uncertainty involved here. Things might not turn out so bad in a given region, or they might turn out far worse; but it's worth noting that the consequences of global warming so far have tended to meet or exceed climate scientists' most pessimistic forecasts.

Monday, June 29, 2009

The Cost of Cap-and-Trade by State

So there's a bill to do something about global warming that's wending it's way through the US Congress; it's known as Waxman-Markey, after its two main sponsors. The bill would institute a cap-and-trade system that would limit CO2 emissions; if implemented, it would ultimately have some cost to consumers - about $175/annum for the average American household by 2020. But those costs wouldn't be distributed evenly, and Nate Silver has a map of how those per-household costs would break down by state:

cap and trade cost by state

Nate has all the gory methodological details in his post. I just want to make two points:

1) This bill is, by itself, inadequate, has gotten watered down considerably already, and will undoubtedly be further watered down in the Senate; and, indeed, I'd be shocked if it passed the Senate at all. But the way to think about it, I think, is as a contribution to a conditional chain: if the US government fails to do anything in the reasonably near future to fight global warming, then horrible catastrophe is inevitable; but if the US does pass even a weak bill, then an international agreement becomes more likely; and if that happens, then altering the energy-intensive development of China becomes a possibility; and if that happens, then we might be able to moderate the slew of catastrophic consequences that are gathering for the end of this century.

2) The United States is not really a democracy, not by modern standards. I'm not talking about all the corruption, the lobbying, and the tilting of the playing field toward special interests, though you could surely make a decent case for the non-democraticness of the US on those grounds alone.

What I'm talking about, though, is the US Senate. Wyoming, which has about half a million people, has two senators. And New York, which has about 19,000,000 people, also has two senators. Florida, which might well be drowned in a century or two by rising seas, has 18,000,000 people and two senators. West Virginia, which produces a lot of coal, has less than 2 million people - and two senators. You see where I'm going with this? The United States government, which was revolutionary and awesome back in the 18th Century, should no longer be considered to have a legislature that meets modern standards for representative democracy. I'm not the first to point this out, of course, but it really doesn't get the attention it deserves. I mean, the form of government of the US is obsolete: why isn't this a matter for public discussion? And of course, the skewing of representative democracy tends to pull in favor of rural areas, which tend to both use and produce more in the way of CO2-heavy fossil fuels, and against urban areas, which are more energy-efficient and more supportive of efforts to fight global warming. So, to the litany of insidious aspects of the global warming challenge, add this: the outmoded institutional structure of the United States government.

Wednesday, June 24, 2009

The Slow Melt of Antarctica

A little while ago the New York Times' Andrew Revkin had a post about a study by David Pollard and Robert DeCanto that found that even in the worst case, global warming would lead to a collapse of the Antarctic ice sheet much more slowly than was previously thought. That process is illustrated in this video:


Says Revkin:
The bottom line? In this simulation, the ice sheet does collapse when waters beneath fringing ice shelves warm 7 to 9 degrees Fahrenheit or so, but the process — at its fastest — takes thousands of years. Over all, the pace of sea-level rise from the resulting ice loss doesn’t go beyond about 1.5 feet per century, Dr. Pollard said in an interview, a far cry from what was thought possible a couple of decades ago. He, Dr. DeConto and other experts on climate and polar ice stressed that when Greenland’s possible contribution to the sea level is added, there’s plenty for coastal cities to consider. But for Greenland, too, some influential recent studies have cut against the idea that momentous coastal retreats are likely anytime soon.

Over all, the loss of the West Antarctic ice from warming is appearing “more likely a definite thing to worry about on a thousand-year time scale but not a hundred years,” Dr. Pollard said.
Well, that's good. I have to say, though, that rising sea levels have never seemed like the scariest threat from global warming. Terrible for Bangladesh, yes, and a few other places around the world; but something that, even on the scale of hundreds of years, let alone thousands, is something to which we could adapt. The collapse of ecosystems, the desertification or aridification of productive agricultural land, and the resultant famine, mass migrations, and political instability, though - those processes will play out in a much faster, unpredictable, and destructive way.

Monday, June 1, 2009

Carbon Footprints, Transit Ridership and More

Via Good, the Housing and Transportation Affordability Index has some excellent maps for several dozen US metros that pertain to housing, transportation, and energy issues. This one shows CO2 emissions from auto use per capita in the New York City area:

nyc co2

The numbers go way, way down as you move towards the urban center. Of course, most people in New York City don't even own cars. But maybe a bit more surprisingly, the pattern is almost as striking in cities where sprawl is rampant. Here's Atlanta, for instance:

Photobucket

The gray lines are freeways and the black lines are Marta rail lines. It looks like per capita CO2 use is highest both along the Marta lines and near freeways; in the case of the latter, that's presumably because the sprawl is somewhat more dense near freeways. But, of course, the general rule is that the closer you are to the city center, the smaller your carbon footprint.

There are many, many more maps here on a number of variables pertaining to housing and transportation. To pick one at random, here's transit ridership as a percentage of workers in the Bay Area:

transit ridership bay area

There's much more like this - average rents, gasoline expenses, travel time to work, etc.; it's a ton of information that's both fascinating and useful. And all in map form. If you're like me, in other words, this site has the potential to waste a tremendous amount of your time.

Wednesday, May 20, 2009

Global Warming as Mephistophelean Challenge

Ezra Klein points to a study on global warming (pdf) from the Lancet and University College London. As Ezra notes, one of the many complications involved in global warming is that the countries most affected by it will be those that are least responsible for it. Look at these two maps, which Klein posts:


The top map is a cartogram with countries scaled to represent their cumulative CO2 emissions from 1950-2000; the bottom map shows the distribution of mortality as a result of global warming health consequences (in particular, malaria, malnutrition, diarrhea, and flood-related deaths). What's immediately obvious is that those who are most responsible for global warming - the US, Europe, Japan and, increasingly, China - will pay only a small fraction of the price; whereas the countries that makes the most negligible contributions to global warming, especially in Africa, will bear by far the largest burden.

Here's a thought experiment: see if you can imagine a problem that more exquisitely exploits the weaknesses of our nature as human beings than global warming. It's as if the problem were cooked up in the devil's own lab. Consider:

  • It is our nature to look after ourselves. But as you can see here, the countries that will be least affected by global warming are those that are most responsible. They (we) have the least incentive to worry about the consequences.
  • It is our nature to discount benefits that will only accrue in the future. That is, if we are offered $10 right now, we value that $10 more than ten bucks promised to us six months from now. (This is why pretty much everyone procrastinates: we value the present satisfaction of goofing off before working more than the future satisfaction of goofing off after working.) But global warming's greatest effects won't even be felt 6 months from now - they'll be felt more like a century from now.
  • It is in our nature to care about problems that affect us directly, rather than those that affect us indirectly or not at all. But we'll all be dead before the greatest effects of global warming hit. And to the extent that the problems will arrive while we're still alive, they'll manifest in mostly indirect ways: as somewhat higher food prices, say, rather than actual illness or death.
  • It is in our nature to want to accumulate wealth. But the way we've gone about accumulating wealth over the past century or two is causing global warming; and it's not at all clear that the continued accumulation of wealth - a.k.a. economic growth - is compatible with seriously confronting global warming.
  • It is in our nature to respond to sudden and drastic change, rather than incremental change; frogs and boiling water and all that. Global warming is the ultimate boiling frog.
  • It's in our nature to be able to comprehend tangible and local problems, rather than abstract and global problems. The level of conceptual analysis that's required simply to comprehend the problem of global warming goes beyond what most people employ in their daily lives. And mustering the intellectual will to actually weigh the consequences of ignoring or responding to the crisis, let alone actually taking action in response, is a whole order of magnitude more complex.
  • It's in our nature to worry first about our physiological concerns, then about our safety, then about our material satisfaction, and only much later about our needs for things like living in a sustainable society, or having moral concerns for people not yet born. For any given person at any particular point in time, their physical and material needs are likely, in general, to lead to actions that contradict the actions that are called for by their abstract ethical concerns about future generations or people in distant lands; and since the physiological and material needs are more fundamental, there is every reason to expect them to win out.
  • It's in our nature to have difficulty working together in large organizations. Yet global warming requires that we work together with an unprecedented degree of global cooperation.

That's just a partial list of the really fundamental aspects of human nature - a nature that has evolved over millions of years to deal with a very different set of problems - which seem almost perfectly unequipped to deal with a problem like global warming. This is why I'm not especially optimistic about our ability to come to grips with this problem before widespread calamity is ensured, and why I expect the people of the late 20th and early 21st Centuries will go down in history as the people who traded a healthy world for a pile of Big Macs and SUVs.

On the other hand, if we are able to meet the challenge, think of what that would mean: that we were able to overcome everything innately self-interested and short-sighted and stupid in our nature to retain a livable home for future generations. That, to me, seems like enough reason to keep trying.

Tuesday, May 12, 2009

Visualizing Global Warming

Andrew C. Revkin talks about the need to use visualizations to make the rather abstract problems of global warming comprehensible. He links to Global Warming Art, which has a bunch of maps and images depicting global warming in one way or another, including this map of temperature anomalies over the past decade:


And this nice map of average annual temperatures:


And this map predicting global warming for the latter part of this century:


And this map of glacier thinning:


And this map of areas at risk from rising sea levels:


And this map of areas affected by tropical storms:


And this topographic map of what an ice-free Antarctica would look like:


Lots of graphs there, too.

Monday, April 13, 2009

Australia is the Canary in the Global Waming Coal Mine

The future is here, and it is Australian. This map shows the expected spread in the range of dengue fever on the continent - almost all the way to Sydney.


According to this LA Times article, Australia is experiencing some of the first pronounced effects of global warming:
They call Australia the Lucky Country, with good reason. Generations of hardy castoffs tamed the world's driest inhabited continent, created a robust economy and cultivated an image of irresistibly resilient people who can't be held down. Australia exports itself as a place of captivating landscapes, brilliant sunshine, glittering beaches and an enviable lifestyle.

Look again. Climate scientists say Australia -- beset by prolonged drought and deadly bush fires in the south, monsoon flooding and mosquito-borne fevers in the north, widespread wildlife decline, economic collapse in agriculture and killer heat waves -- epitomizes the "accelerated climate crisis" that global warming models have forecast.

With few skeptics among them, Australians appear to be coming to an awakening: Adapt to a rapidly shifting climate, and soon. Scientists here warn that the experience of this island continent is an early cautionary tale for the rest of the world.
Among those cautionary experiences: a heat wave that killed 200 people in February, followed by fires that killed another 173, as well as - and this astonished me - "a quarter of Victoria state's koalas, kangaroos, birds and other wildlife." Meanwhile, the drought in Victoria has desiccated the country's breadbasket; rainfall has been less than half of average for more than a decade. The article characterizes the agricultural sector as "collaps[ing]," along with the country's self-sufficiency in food production. And even as the once-fertile south literally dries up and blows away, the tropical wet season in the north is becoming longer and more severe, with flooding and cyclones becoming more frequent. Higher water temperatures are bleaching the coral of the Great Barrier Reef, with one report saying the reef will become "functionally extinct" by 2050. That's barely 40 years from now. Inland wildlife, meanwhile, is being chased up the slopes of Australia's smallish mountains by advancing heat.

Australia, however, likes to burn coal. Its people enjoy the electricity provided by burning coal, and they like the economic growth that comes from such a cheap energy source. So, they are the world's highest per-capita producers of greenhouse gases, which means they are contributing disproportionately to the withering and charring of their own country. That is, you'll note, ironic.

Australia. Apocalypse. I think we all know where this is headed.

Wednesday, March 25, 2009

Survival Map for the Apocalypse

New Scientist maps the global warming apocalypse.


The accompanying article, by the aptly named Gaia Vince, depicts a scenario in which Earth warms by 4C by the end of this century. The future she foretells is a grim one: most of the world between about 40 degrees north and 40 degrees south will have become a vast desert, uninhabitable by humans, rendering most of the world's food-producing regions barren wastelands. The Sahara will spread into central Europe, and Japan and eastern China will become Gobified. South Asia will suffer from a fiercer but briefer monsoon, producing both more floods and more drought; much of Bangladesh will disappear altogether under rising seas. Rivers in Europe and Asia will wither. The Amazon might simply go up in a vast inferno. Vince suggests that 90% of the human population won't make it through these calamities.

Interestingly, there's a precedent for this kind of scenario:
The last time the world experienced temperature rises of this magnitude was 55 million years ago, after the so-called Palaeocene-Eocene Thermal Maximum event. Then, the culprits were clathrates - large areas of frozen, chemically caged methane - which were released from the deep ocean in explosive belches that filled the atmosphere with around 5 gigatonnes of carbon. The already warm planet rocketed by 5 or 6 °C, tropical forests sprang up in ice-free polar regions, and the oceans turned so acidic from dissolved carbon dioxide that there was a vast die-off of sea life. Sea levels rose to 100 metres higher than today's and desert stretched from southern Africa into Europe.
But of course, human civilization wasn't around back then to be shepherded through the bottleneck of dramatic ecological change. (Nor, presumably, did it happen as quickly as our present blitzkrieg against climatic stability.) How humans might adapt to a recapitulation of such changes will be, Vince suggests, the story of humanity over the next few centuries. The key to it will be an unprecedentedly massive migration. Even as the mid-latitudes wither into desiccated husks, storm systems will wander closer to the poles. With rising temperatures and greater precipitation, Canada, Scandinavia, and Siberia will become the most habitable places on the planet. They'll be our breadbaskets - vast agricultural areas peppered by dense, high-rise cities where most people will live.

Some of these predictions are a bit... horologically aggressive, let's say. Sky-rise cities popping up throughout a verdant West Antarctica? Not in this millennium. And even with a 10C rise, is it really reasonable to envision Siberia as the breadbasket of the world? A Siberia that's 10C warmer is still pretty damn cold. It's also unclear to me why there'd be total desertification near the equator; why would the tropical rain belt shut down? Nonetheless, it's worth noting that the 4 degree rise in global temperatures out of which this scenario is built is actually on the conservative side of current climate change predictions; a rise of 5 or 6C might be more likely. In any event, wake me when it is no longer conventional wisdom that the destruction of the planet is necessary to support a healthy global economy. Until then, I'll continue to assume that something like this apocalyptic scenario is pretty much destined to occur.

Incidentally, for some reason the article also has an interactive google map, which is mostly redundant.

Tuesday, March 10, 2009

The Melting Arctic

The LA Times looks at one of the more terrifying wild cards in the climate cataclysm that continues to bear down on us like a powerful but highly visible and potentially thwartable locomotive.


The trouble is that the Arctic is warming faster than anywhere in the world. And there are tons - literally, hundreds of billions of tons - of global warming gases currently sequestered in the permafrost there. And if the permafrost were to melt, all those gases would be released, which would warm the arctic, which would melt the permafrost, which would release more greenhouse gases... you see the problem. From the article:
Methane (CH4) has at least 20 times the heat-trapping effect of an equivalent amount of carbon dioxide (CO2). As warmer air thaws Arctic soils, as much as 55 billion tons of methane could be released from beneath Siberian lakes alone, according to Walter’s research. That would amount to 10 times the amount currently in the atmosphere...

Today, 20% of Earth's land surface is locked up in a deep freeze. But scientists predict that air temperature in the Arctic is likely to rise as much as 6 degrees Celsius, or 10.8 degrees Fahrenheit, by the end of the century. That is expected to boost the emission of carbon compounds from soils.

The upper 3 meters -- about 10 feet -- of permafrost stores 1.9 trillion tons of carbon, more than double the amount in the atmosphere today, according to a recent study in the journal Bioscience.

"We are seeing thawing down to 5 meters," says geophysicist Vladimir Romanovsky of the University of Alaska. "A third to a half of permafrost is already within a degree to a degree and a half [Celsius] of thawing."

If only 1% of permafrost carbon were to be released each year, that could double the globe's annual carbon emissions, Romanovsky notes. "We are at a tipping point for positive feedback," he warns, referring to a process in which warming spurs emissions, which in turn generate more heat, in an uncontrollable cycle.

It's that positive feedback potential that's so terrifying. Sometimes I like to reassure myself by thinking, well, global warming may leave civilization a crippled wreck, but it's not as af if it will lead to the end of life as we know it. But do we know that for sure? Do we have any sort of grasp on what the upper bound of global warming effects might be? These sorts of positive feedbacks (and there are others, such as the possibility of the Amazon turning into a tinderbox) suggest the possibility that there may be a tipping point beyond which our ability to counter climate change will have evaporated. And no one knows when that day might come.

Friday, February 27, 2009

A Map of Global Warming

A team of MIT researchers has just come out with a new projection of climate change over the course of the 21st Century.


Is this a map? I guess it's both a map and a graph. Anyways, it's a little tricky to read it at first, but look at it this way: every point on the map/graph represents a particular latitude and a particular year; the color of that point represents how much warmer it's likely to be at that given place and time. So, for instance, a location at 40 degrees north latitude (e.g., New York, Madrid, Beijing) is forecast to be about 2C warmer in 2050 and about 6C warmer in 2100. No doubt lots of local effects will come into play, but these temperatures would represent the latitudinal average.

What's immediately striking is how much greater warming is forecast to be near the poles, and especially the north pole. Temperatures there could be more than 10C warmer by the end of the century, a mind-boggling number. And a special added bonus effect of a dramatically warmer acrtic is that the melting of tundra could cause even more greenhouse gases to escape into the atmosphere, instigating a vicious cycle.

The projections are warmer than those made using the same model in 2003. As the paper's abstract says:
the median surface warming in 2091 to 2100 is 5.1°C compared to 2.4°C in the earlier study. Many changes contribute to the stronger warming; among the more important ones are taking into account the cooling in the second half of the 20th century due to volcanic eruptions for input parameter estimation and a more sophisticated method for projecting GDP growth which eliminated many low emission scenarios. However, if recently published data, suggesting stronger 20th century ocean warming, are used to determine the input climate parameters, the median projected warning at the end of the 21st century is only 4.1°C. Nevertheless all our simulations have a very small probability of warming less than 2.4°C
And what would a 4-5C rise in temperature look like?
Globally, a 4C temperature rise would have a catastrophic impact.

According to the government's 2006 Stern review on the economics of climate change, between 7 million and 300 million more people would be affected by coastal flooding each year, there would be a 30-50% reduction in water availability in Southern Africa and the Mediterranean, agricultural yields would decline 15 to 35% in Africa and 20 to 50% of animal and plant species would face extinction.
That's one of the somewhat optimistic scenarios in the MIT report. And the image above depicts a middle-of-the-road model for both climate change and economic development. But there's been a tendency for observed changes in climate patterns and sea ice to push the upper bounds of what scientists have been predicting. If that continues to be the case, then a merely catastrophic outcome may be the best that we can hope for.